By Prasoon Singh and Suruchi Bhadwal, The Energy and Resources Institute
The phenomenon of temperature rise in urban centers, has gained attention in the recent decades. Known as the Urban Heat Island (UHI) effect, it was first conceptualized by Luke Howard in the early 1800s. Since then, several attempts have been made to study this effect vis-à-vis respective peri-urban surroundings in metropolitan landscapes. These studies have shown that the urban areas undergoing change in land cover, i.e adopting more asphaltic and concrete surfaces, have a larger role in temperature change. This, coupled with air pollution, unsustainable resource use, and haphazard urban development contribute to a changing thermal profile. The cumulative effect of all these anthropogenic activities traps the radiative heat in the atmosphere causing this rise in temperature.
Most studies conducted on UHI, rely on remotely sensed data collected by a satellite’s sensor. These sensors provide images in a particular bandwidth, the thermal infrared band, which provides thermal images with high spatial and temporal resolutions. Other data is collected as ambient air temperatures to further assess temperature change. A visual example of these data sets would be in the form of an Isothermal line that maps the temperature change in peri-urban and urban areas. The profile curve takes the shape of an island due to the high variability in temperature between urban and peri-urban areas (see Figure 1). Essentially, the difference between the two sides is because of high temperatures faced in urban centres versus the lower temperatures in rural areas. Some profiles have marked a 12 degree difference across cities, which is a cause for concern.
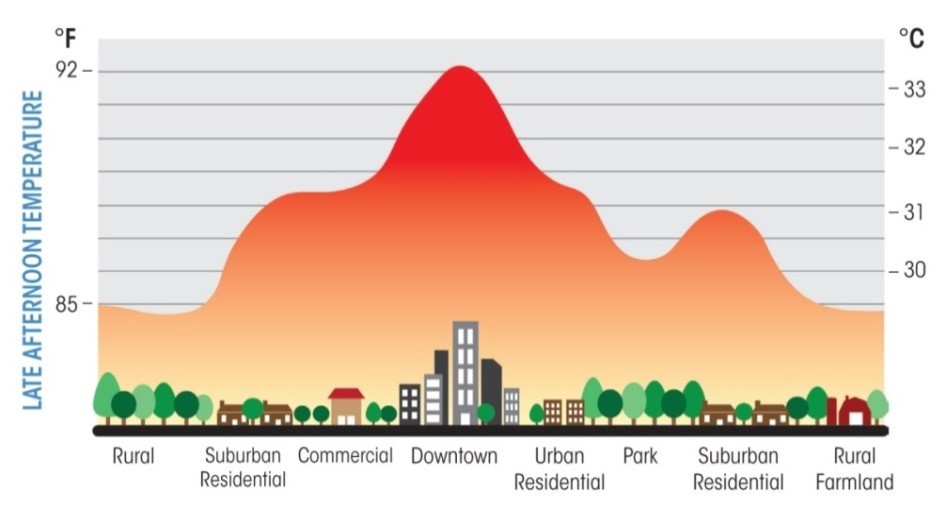 Figure 1: Representative image of Typical UHI Isothermal profile of an urban setup
In order to understand these changes further, TERI along with ALTERRA (Wageningen UR) has helmed Delhi as a case study site, under its HI-AWARE project component. The study focuses on the rising heat stress in Delhi’s neighbourhood and its successive impact on human health. For such a study to be a success, the prerequisite is that a good data set containing weather parameters in temporal and spatial scales exist. Hence the need of an Automatic Weather Station (AWS), that has been installed in in Vasant Kunj (South Delhi) (see Figure 2). The selection of this site was based on reconnaissance surveys conducted on IMD guidelines.
The AWS, operational since April 2016, has collected hourly data on temperature, humidity, heat index, wind direction, wind speed and incident solar radiation. Before analysis of this data set, the data was calibrated to comply with data that is gathered by IMD weather stations.
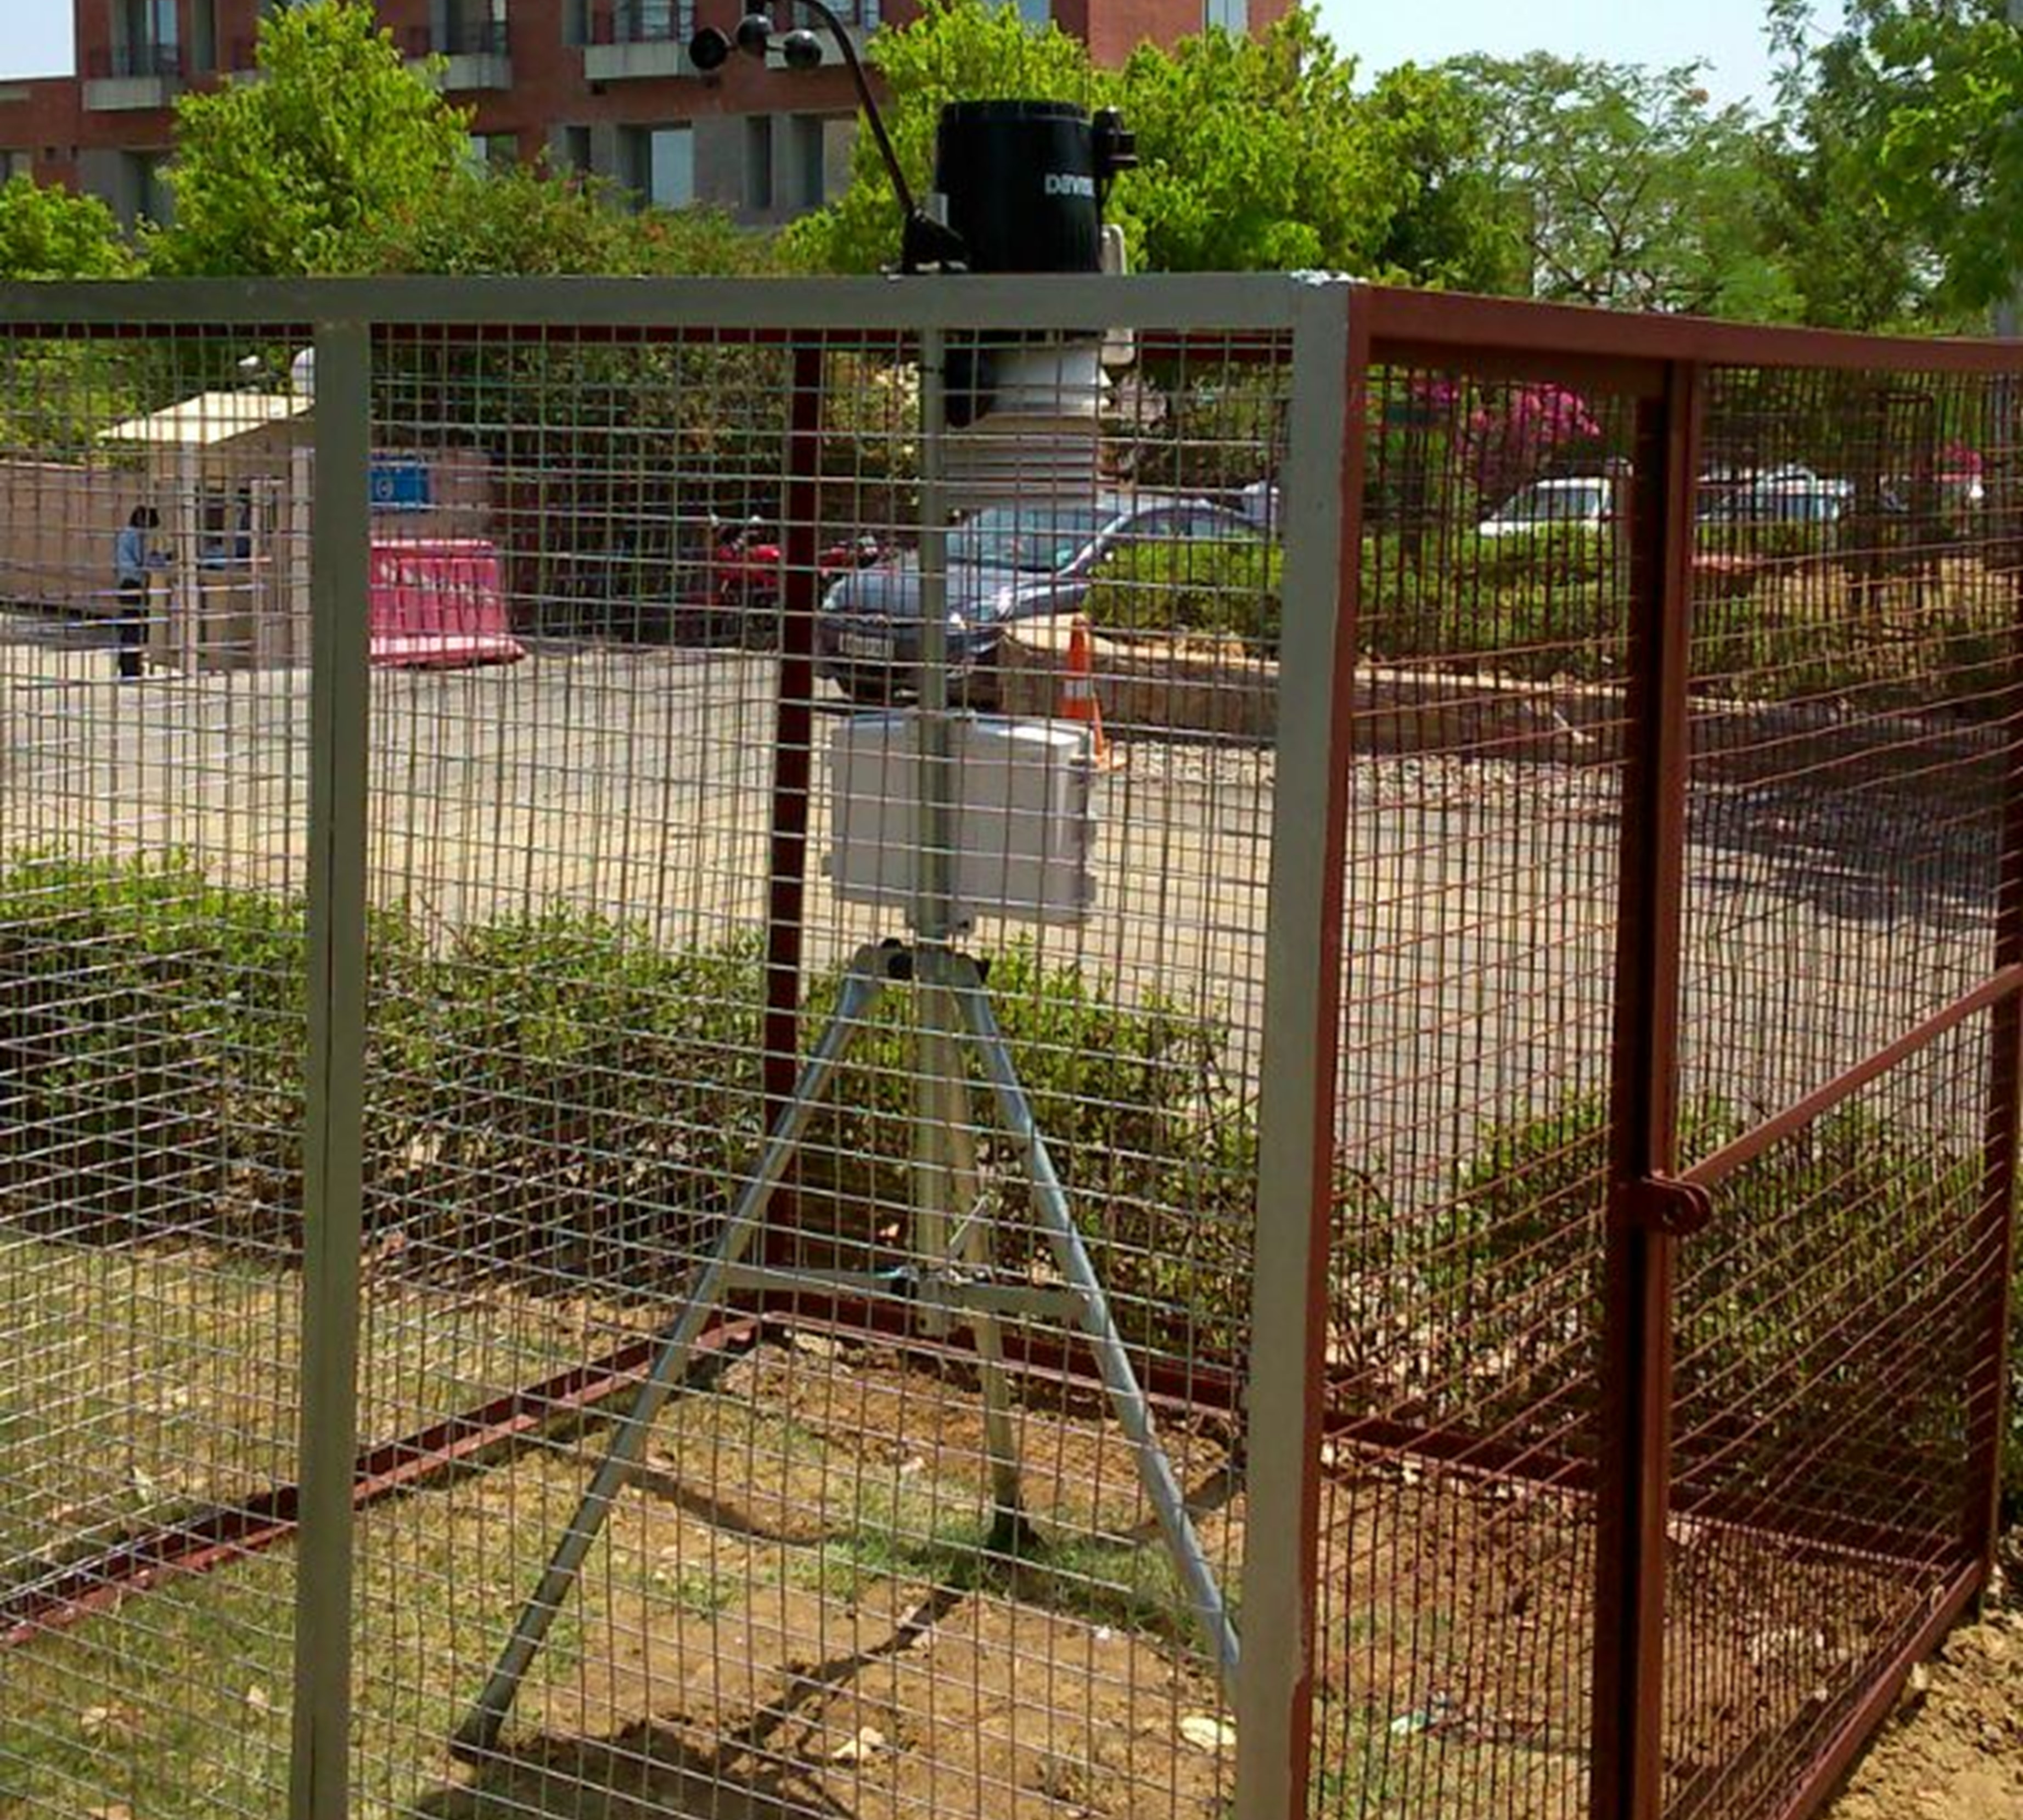 Figure 2: Automatic Weather Station Installed at TERI University
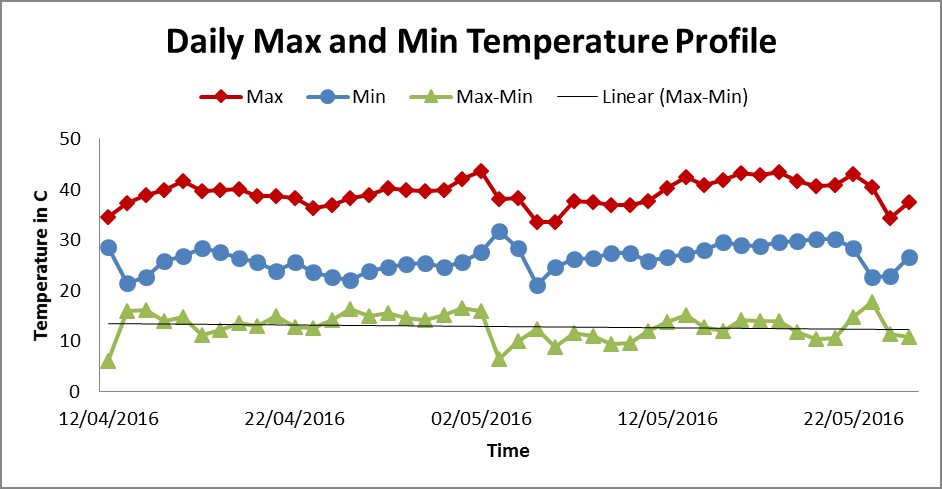 Figure 3: Daily Temperature Data Series
The results indicate that the Heat Retention Capacity (capacity of atmosphere to contain heat) gradually increases from April to May (see Figure 3). This also means that the difference between maximum and minimum temperatures has decreased as well. Further analysis of the data set is required for conclusive evidence in seasonal and diurnal variations. This requires a considerable amount of data to be collected, which is hoped to be done in the course of the study.
Note:
Figure 1 is from a paper by Giridharan et al., 2004 titled: ‘Daytime urban heat-sland effect in high-rise and hig-density residential developments in Hong Kong‘
ALTERRA is now known as ‘Wageningen Environmental Research (ALTERRA)’