By Tanya Singh, Alterra
The recent heat wave events in Pakistan (June 2015) and India (May 2015) took a toll of thousands of lives. Heat waves, resulting from a host of factors such as extreme temperatures, relative humidity, solar radiation and wind speed, can claim lives even in regions where one would expect people to be used to the heat. Most studies which establish a relation between health outcomes and extreme heat rely on meteorological data from standardised weather stations outside of city limits. These do not reflect well heat exposure in urban residential areas. A better understanding of heat variations related to the environment – both indoor and outdoor – is, therefore, needed to help design low-cost interventions in resource-poor countries, such as in South Asia.
A HI-AWARE team led by Alterra-Wageningen University and Research Centre is planning an elaborate indoor and outdoor heat measurement campaign in South Asia in 2016. To better reflect heat exposure and adaptation measures on a local urban scale, Alterra has designed its own ‘mobile device’ for measuring outdoor heat. Furthermore, the campaign will explore what kinds of low-cost houses can offer the best protection against heat to city dwellers.
Toward that end, Alterra, in collaboration with the Pakistan Agriculture Research Council (PARC) and the Government College University Faisalabad (GCUF), rolled out a trial phase of the campaign in Faisalabad, Pakistan, over a six-day period in July 2015. This comprised a mixture of classroom sessions, discussion meetings, field visits, data collection activities, and quick analytical work.
Instrumentation
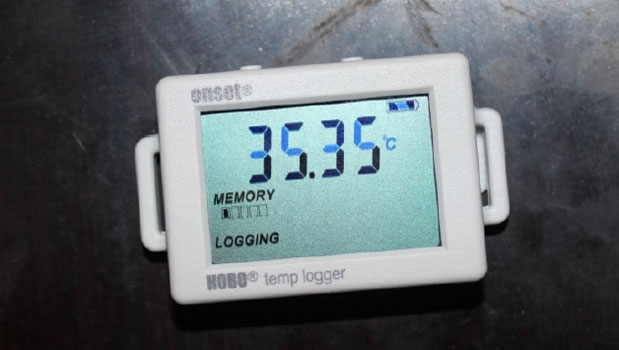 The HOBO® Temp Data Logger, UX100-001, here fixed on a cupboard in a household in Faisalabad, Pakistan, measures and stores air temperature in fixed intervals of 10 minutes in houses constructed of different building materials.
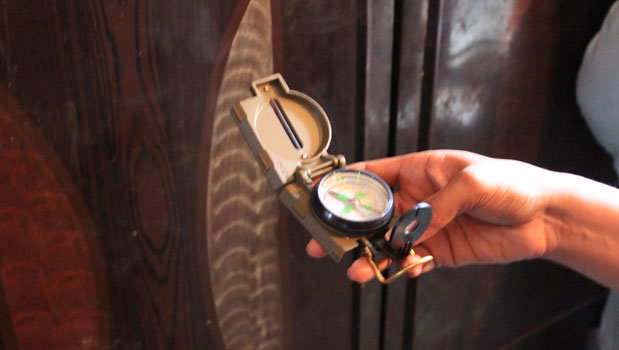
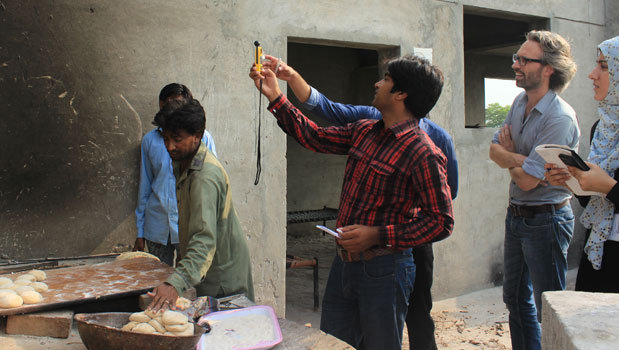 Additionally, wind speed, black globe temperature, and relative humidity were measured with a handheld device, Kestrel 4600. A fixed outdoor meteorological station (DAVIS AWS) will be used additionally to support better analysis.
 A ‘mobile device’, which can be fixed on a vehicle and driven around, records air temperatures (shielded and ventilated), fast response temperatures, relative humidity, wind speed and direction, radiation and GPS data (position, altitude, speed, and direction), and delivers data in two-second intervals.
Training
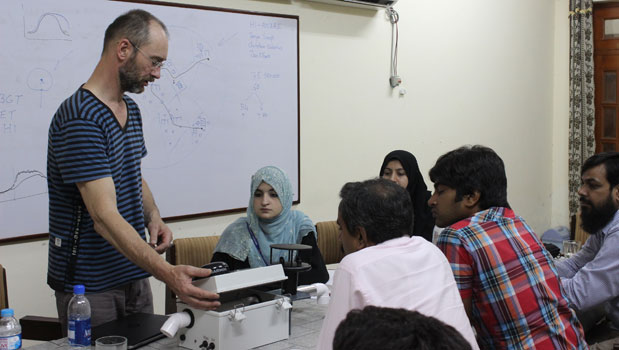
 Local students are trained on how to use the Kestrel handheld device for additional indoor and outdoor measurements to calculate thermal comfort indices like the wet bulb globe temperature (WBGT), which is a good indicator of how people actually experience heat.
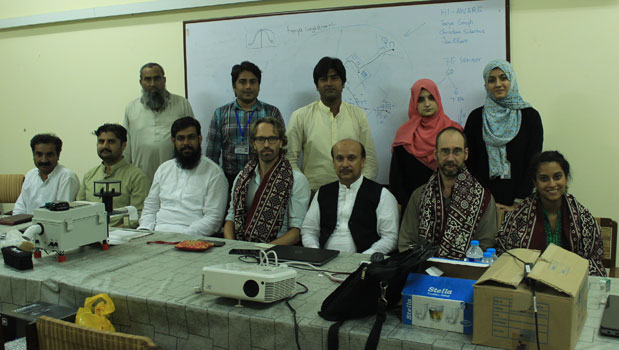 The research team after the last classroom session at the Government College University Faisalabad (GCUF).
Indoor heat measurement sites
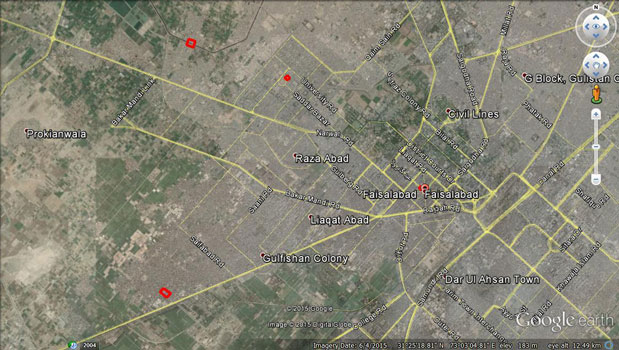 Google Earth map showing the location of the four indoor heat measurement sites (marked in red).
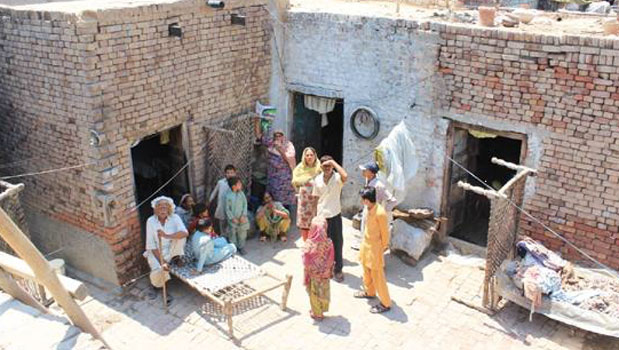
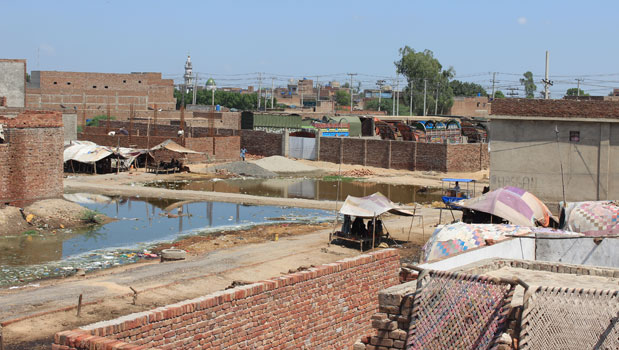 This poor neighbourhood in North-West Faisalabad, close to Babuwala, was chosen as one of the four sites for indoor heat measurements.
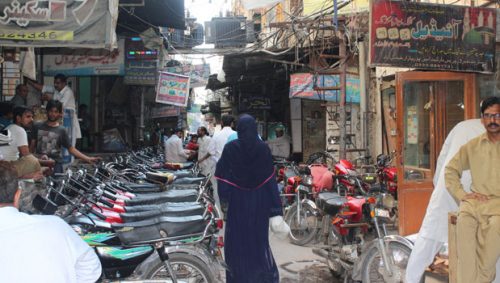 Another of the sites was chosen in the city centre, close to the clock-tower, for indoor heat measurements.
Indoor heat measurement
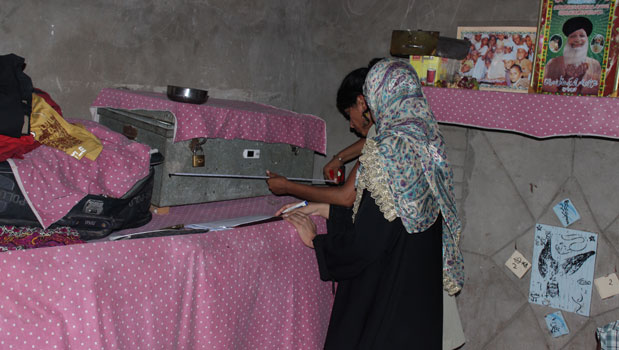 Installing the data logger approximately 1 m from the floor and ceiling and away from any sources of heat, cold, moisture and dryness (e.g. windows exposed to sunlight, heaters, lights, air conditioners, fans, evaporative coolers, south-facing walls) is recommended. However, keeping only a distance of 1 m from the floor was not always possible, as household members were worried that their children would play with the data loggers and in this manner disrupt the measurements.
 The orientation of the walls close to which the loggers were fixed were noted down for each logger. Furthermore, for each household it was noted how far the logger was installed from the ground and wall, roof and wall type and their colour, presence of a fan or evaporative cooler, number of windows, floor number, GPS coordinates and the data logger serial number.
 First household in which a data logger was installed. In total, 40 data loggers were installed across 31 households.
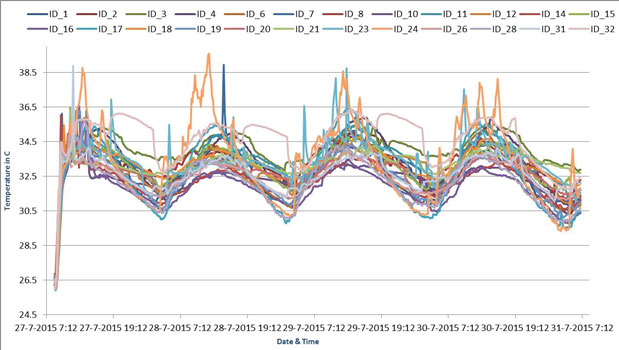 Graph shows indoor temperature distribution (in °C) amongst a selection of 24 households. A difference of around 3 °C degrees at some moments is observable between households during night time.
Outdoor heat measurement
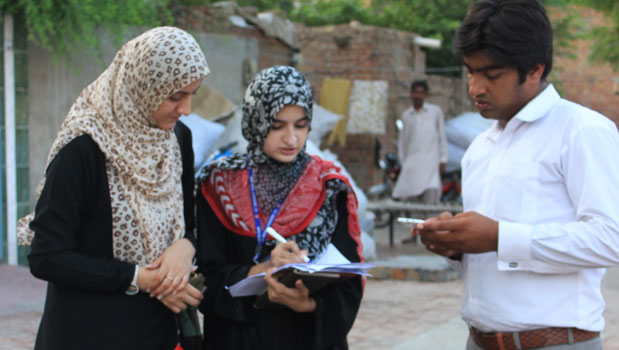
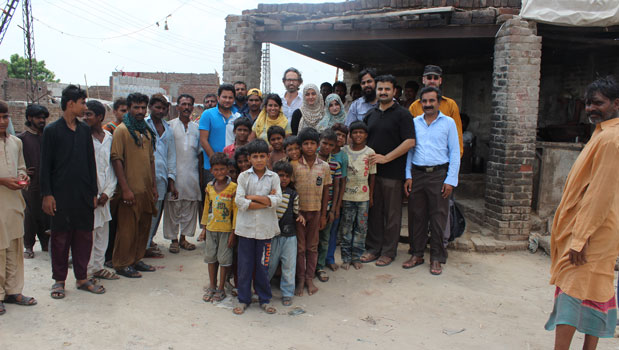 A challenge during the installation was to gain the trust of the household dwellers and to assure them that the data loggers do not record anything else than temperature. Also a few people were concerned that the research team was from a governmental agency trying to map the area and at some point would chase away the dwellers. However, overall people were very warm and welcoming.
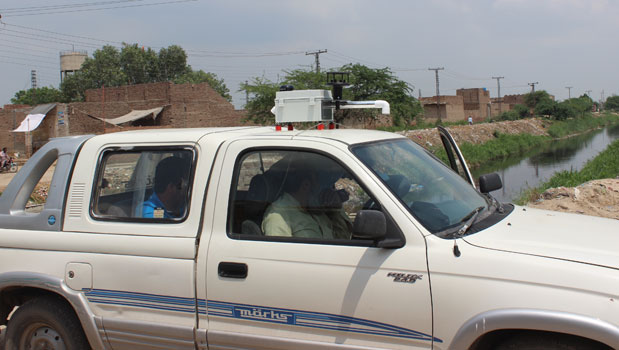 The ‘mobile device’ (see photo 3) is fixed on the roof of a vehicle. It delivers temperature data in two-second intervals (see maps below). For the mobile measurement, a transect of maximum 20 km had to be defined – the transect was to go through diverse residential neighbourhoods, including the neighbourhoods where the indoor measurements would be taken.
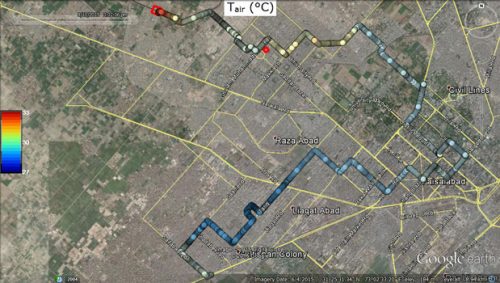 The map shows a mobile transect conducted during day time. The coloured dots each represent a temperature value along a colour gradient (see colour legend on the left) in degree Celsius (°C). Blue coloured dots have a lower air temperature value compared to orange/red dots, which represent hotter spots. It was raining during this day time transect on a large part of the route, which made the temperatures drop.
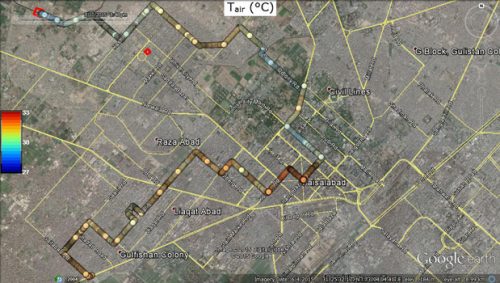 The map shows a mobile transect conducted during night time. Note that the night time transect slightly differs from the day time route (see map above). This is because construction work was going on and the road on the transect was not accessible to cars. Interestingly night time temperature were higher than day time temperature on this particular measurement day. This might have been caused by the fact that during night it was not raining and a different wind pattern. The urban heat island effect might have caused as well that temperature climbed up. However, this needs to be analysed further in the next steps.
The way forward
Based on the results of this test study and lessons learned, the HI-AWARE team will conduct additional indoor heat measurements in 180 households across three cities in South Asia, one each in Bangladesh, India and Pakistan, not to mention outdoor heat measurements in the three cities.