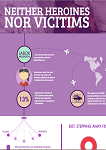
Neither Heroines; Nor Victims
Infograph, 2017
Rather than focusing on a (necessary) critique of labour markets and on the high human, social and financial costs of migration, this infograph gives a voice to the subjectivities of migrant women in Nepal.
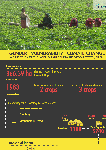
Gender, Vulnerability and Climate Change: A case study of the Labdu Dhikure Shera Irrigation System
Infograph, 2017
Prajjwal Bhandari explores the irrigation system of Labdu Dhikure Shera, where women report of increased climatic stresses rendering the community vulnerable to climate change impacts.
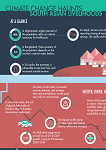
Climate Change Haunts South Asian Livelihoods: An Infograph
Infograph, 2017
Vulnerability in South Asia is projected to increase as livelihoods continue to be jeopardised by physical factors such as resource damage, various meteorological changes and the widespread effect of water and vector-borne diseases. This infograph explores these issues.
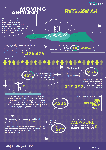
Moving Around: Human Mobility in the Gandaki Basin
Infograph, 2017
Given the recent #Nepal #floods it is no surprise that a large number of people have been displaced. Based on a web graphic by UN Nepal Information Platform, the number of displaced households stands at 91,000. Family members will undoubtedly move in search of better opportunities, better resources and a better way of life for their loved one.
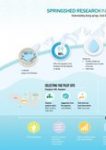
Springshed Research in the Gandaki Basin of Nepal
Infograph , 2016
An infographic representation of springshed research carried out by HI-AWARE in the Gandaki Basin in Nepal. It graphically represents research methods, selection methodology and areas of action..